
Migratory Birds as Connectivity Indicators
The Remote Sensing and Landscape Science team (part of the NSW Department of Climate Change, the Environment, Energy and Water), aimed to validate the habitat connectivity model from the NSW Biodiversity Indicator Program (BIP) using on-ground evidence.
Migratory connectivity is the geographic and temporal linking of individuals and populations between one life cycle stage and another, such as between breeding and wintering locations for a migratory bird.
This research was primarily focused on observation records of nomadic bird species in NSW. The project focused on leveraging these bird records of common mainland species for their richness in data, spatial records, and ecological significance.
The study focused on validating habitat connectivity using the movement patterns of common bird species, including some pollinators. Sightings of these birds, collected and cleaned from
multiple years, provide a rich source of field data to validate where connectivity is predicted to be high. The spatial relationship between these migratory birds and the habitat connectivity layer was examined, despite challenges such as mixed resident and movement data, biased
survey effort and inaccurate records.
The project aimed to address theoretical and methodological challenges and assess whether the selected bird species use identified connectivity pathways, identifying potential gaps in the BIP model. The goal is to provide insights for improving the habitat connectivity layer and assist the agency to assess mapping proposals.
The Challenge
Connectivity is widely used in government biodiversity policy, but there is limited linkage between models and field evidence.
Three key hypotheses were tested:
- The migration patterns of common mainland bird species are expected to correlate with areas of higher connectivity as identified by the BIP connectivity layer.
- Potential bias from observation locations concentrated in high-connectivity areas can be mitigated by incorporating data from all sampling sites, regardless of positive sightings. Additionally, quantifying survey effort aims to address and account for observation bias in the analysis.
- During migration periods, there is expected to be a stronger correlation in positive bird sightings in areas of higher connectivity compared to non-migration periods.
The Solution
The project commenced with the selection of bird observation records for relevant bird species, considering attributes such as temporal details, species count, observation accuracy, and type. These records, spanning the last 20-30 years and even dating back to the 1880s, were crucial for the project’s objectives. A weekly aggregation of observations over the entire year provided insights into potential migration patterns, revealing a gradual movement of species from south to north in autumn and north to south in late spring. The use of density-based clustering analysis showed weekly changes, offering a nuanced understanding of bird movement patterns.
Observation accuracy ratings played a pivotal role in determining buffer distances for each observation point. Utilising this buffer, a zonal statistics function assigned BIP connectivity ratings to each observation buffer. The extracted results for all observations per species were then compiled into a Microsoft Excel table for subsequent in-depth analysis to compare connectivity against observations.
The final stages of the project involved an examination of possible observation bias by exploring the relationships between observation effort and actual sightings. Leveraging geostatistical methods like kriging and inverse distance weighting, observation density grids were generated alongside a survey effort grid. A comparative analysis of these surfaces unearthed disparities attributable to observation bias, providing crucial insights into the reliability of the bird observation data.
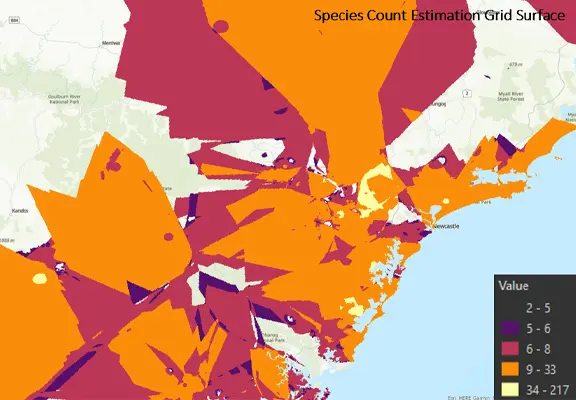
Species density (or distribution) surface based on the number of Swift Parrot birds recorded in NSW.
The Benefits
The scope of work undertaken assisted NSW DCCEEW in several ways:
- The analysis provided insights into how connectivity spatial models should be interpreted
and may be calibrated in future. - While data variability and bias made it difficult to reach definitive conclusions, for some species connectivity values did change during the year, but linkages to migration was unclear. There was significant variation between species, and it may be that the connectivity values differ in the regions that the species are migrating to or from, rather than necessarily along the pathways that the species use for migration.
- The study was a valuable first step in considering how field data records can be used to calibrate connectivity maps and models.